

What is the Writesonic GEO Presence Connector?
The Writesonic GEO Presence connector for Google Looker Studio lets you import your AI search visibility data directly into Looker Studio. Create custom BI dashboards and reports using your brand performance data from AI platforms like ChatGPT, Perplexity, Claude, and Gemini.What this does for you
- Real-time data access: Connect directly to your GEO Presence project for up-to-date visibility metrics
- Custom visualizations: Create charts, graphs, and tables that match your reporting needs
- Team collaboration: Share dashboards with stakeholders and team members
Getting Started
What You Need:
- A Writesonic account with GEO Presence access
- Your Business API key
- A Google account with Looker Studio access
Step 1: Access the Connector
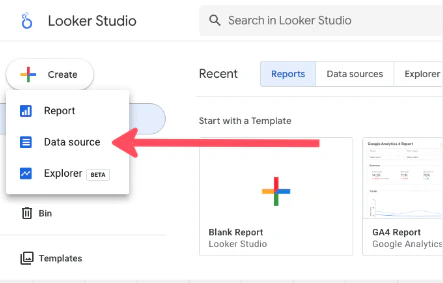
- Open Looker Studio
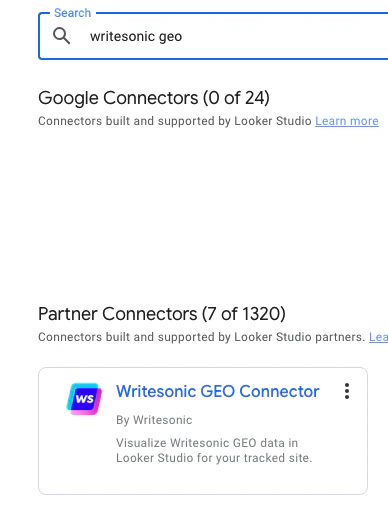
- Click Create → Data source
Step 2: Authorize the Connection
- Click AUTHORIZE to begin authentication
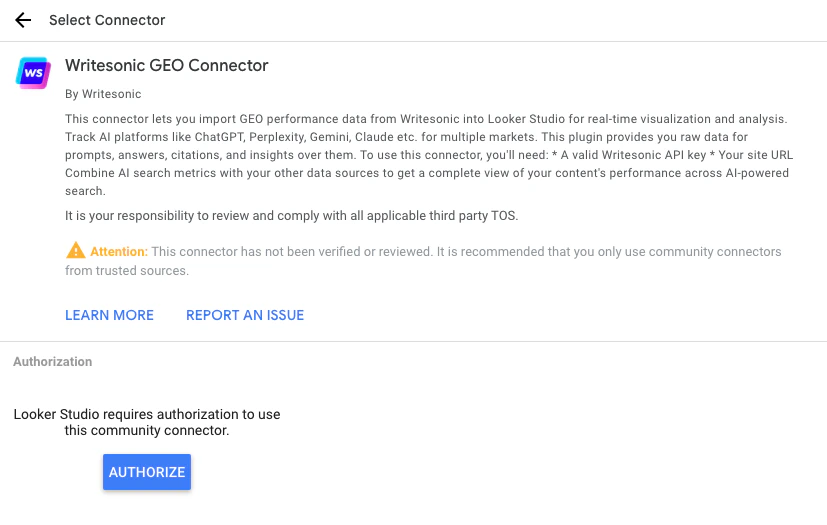
- Sign in with your Google account if prompted
- Grant the necessary permissions
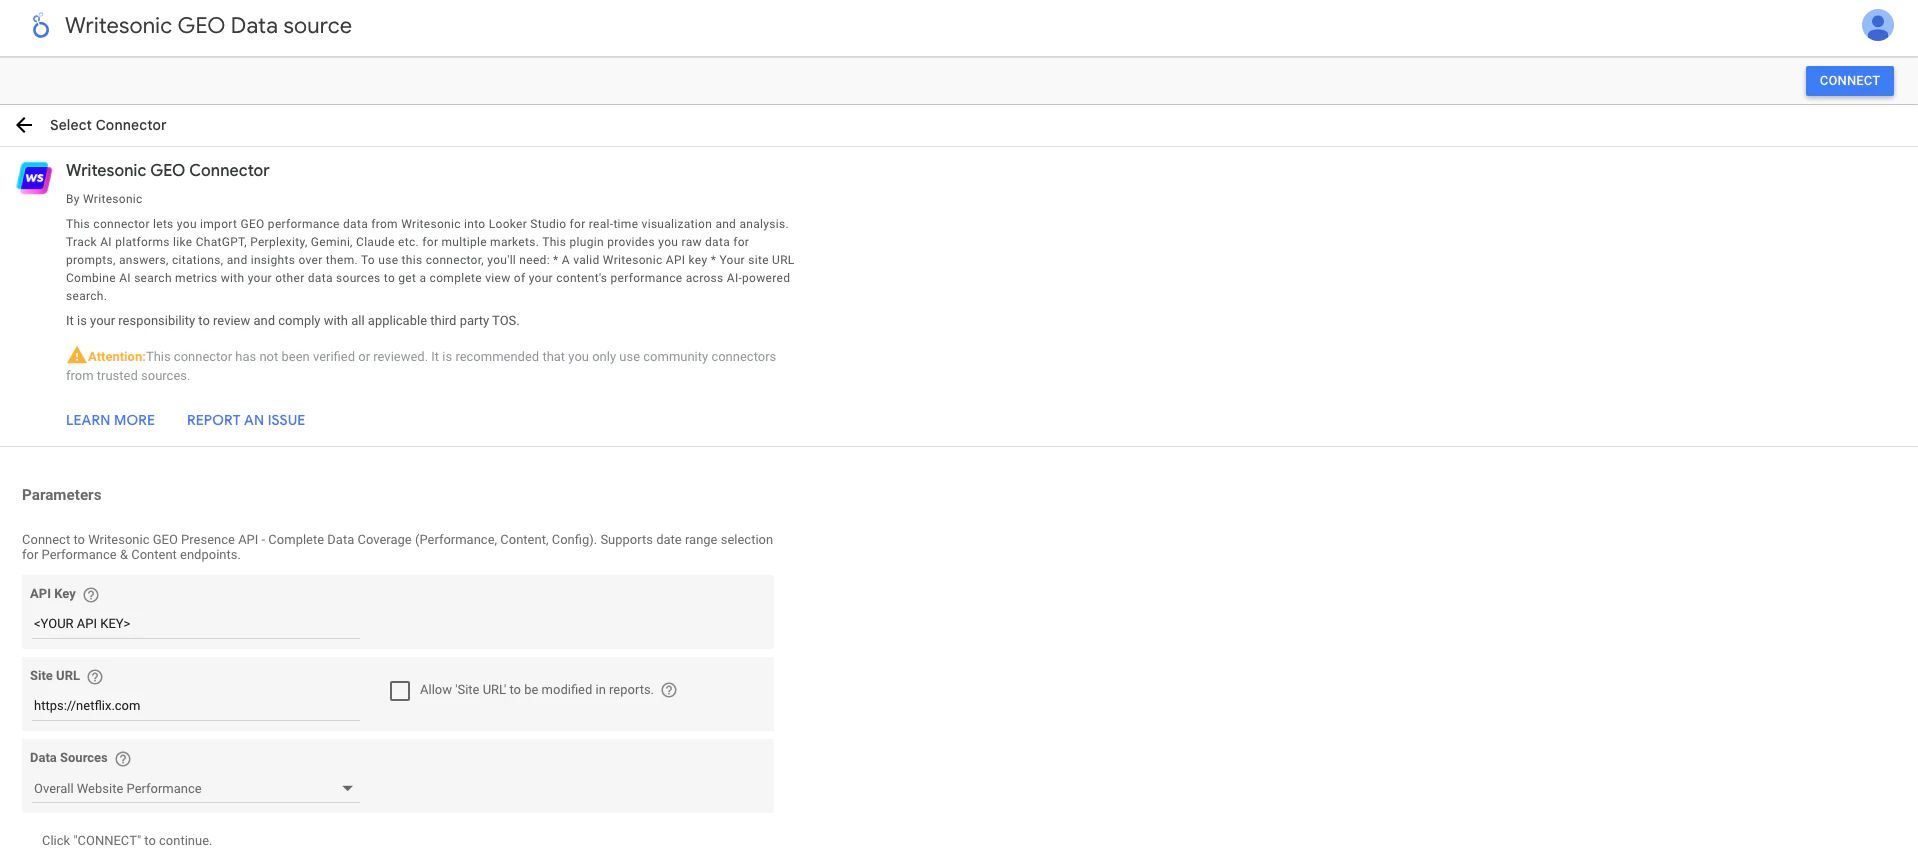
Step 3: Configure Your Data Source
- Enter your API Key from Writesonic
-
Enter your Site URL (e.g.,
https://example.com)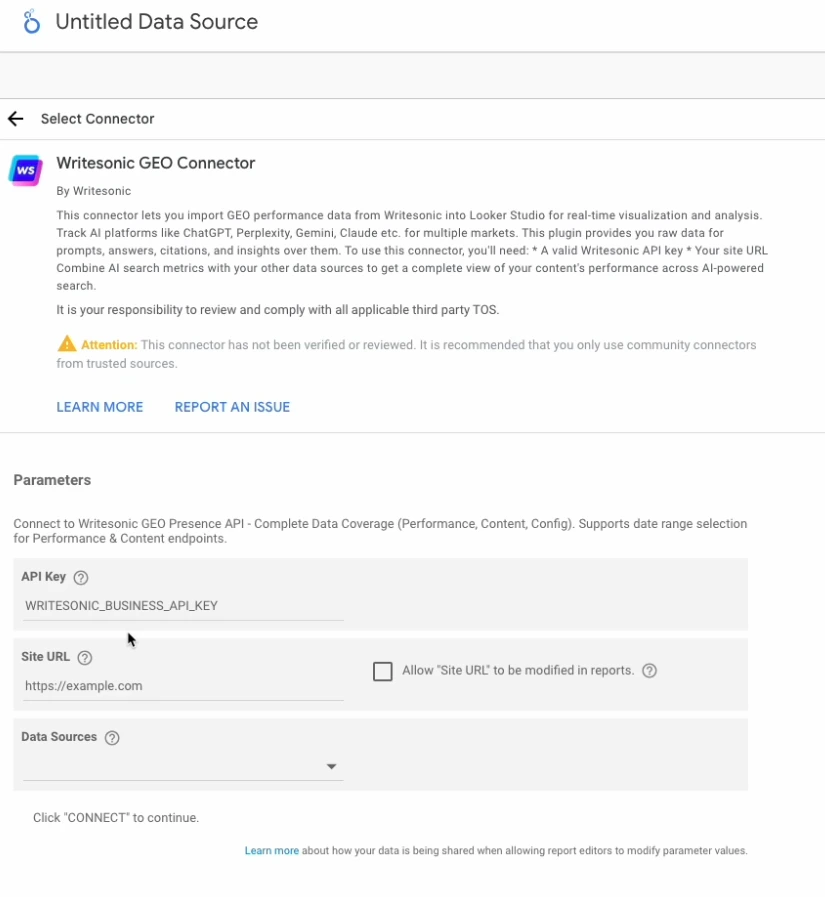
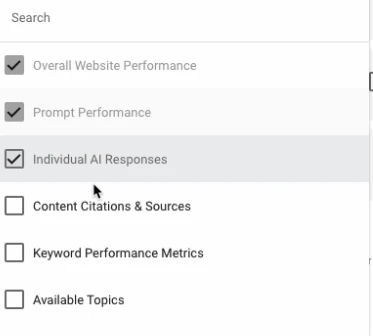
- Select one or more Data Sources
Step 4: Connect and Validate
- Click CONNECT
-
Review the available fields
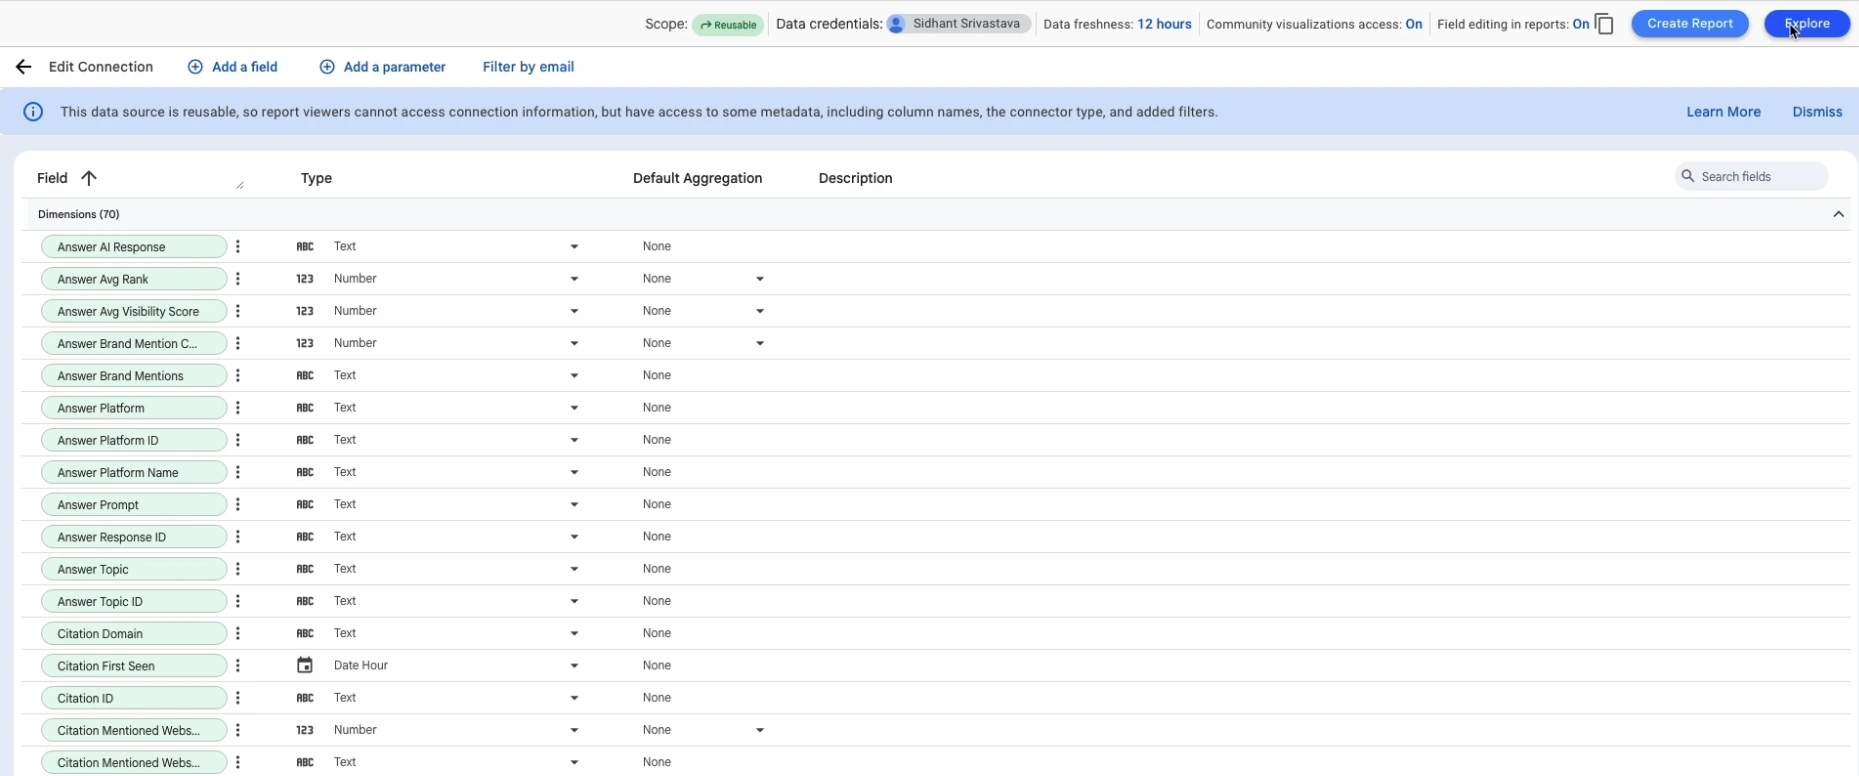
- Click CREATE REPORT/EXPORT to start building
Understanding Data Sources
The connector provides access to 10 data sources:Performance Data Sources (Require Date Range)
Overall Website Performance — Track brand performance metrics aggregated by website, including total prompts, mentions, visibility scores, and rankings over time. Prompt Performance — Analyze performance metrics for individual prompts, showing which queries drive the most visibility and mentions across AI platforms (ChatGPT, Claude, Gemini, etc.). Individual AI Responses — Access complete AI-generated responses with full text, brand mentions, platform details, and competitive context.Content Data Sources (Require Date Range)
Content Citations & Sources — Discover which websites and domains AI platforms cite as sources, including citation URLs, domains, and associated brand mentions. Keyword Performance Metrics — Extract keywords and themes from AI responses to understand what terminology and topics are associated with your brand.Configuration Data Sources (No Date Required)
Available Topics — Reference data of all topic categories used to organize prompts and analyze performance by topic. Available Platforms — Reference data of AI platforms and models (ChatGPT, Claude, Gemini, etc.) being tracked. Tracked Websites — Reference data of all websites being monitored, including your own website and competitors, with metadata like logos and website types. Prompts Information — Reference data of all configured prompts with their topics, tags, status, and country codes. Available Tags — Reference data of all tags used for organizing and filtering prompts.What is a Dimension in Looker Studio?
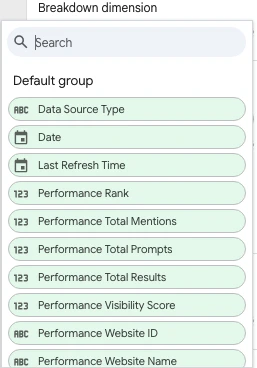
A dimension is a categorical or descriptive field used to group, filter, or segment data. Dimensions are not aggregated; they represent attributes or categories. Characteristics of Dimensions:- Used for grouping and filtering (e.g., by date, category, name)
- Not aggregated (text, dates, IDs, categories)
- Appear in rows, columns, or filters in charts
- Used to break down metrics
Examples from Your Connector
- Date — groups data by date
- Performance Website Name — groups by website
- Performance Topic Name — groups by topic
- Answer Platform Name — groups by AI platform
- Prompt Type — segments prompts into “Branded” or “Non-Branded”
- Config Website Is Self — boolean filter
What is a Metric in Looker Studio?
A metric is a numeric field that can be aggregated (summed, averaged, counted, etc.). Metrics represent measurable values and are used to quantify performance, analyze trends, and calculate statistics. Characteristics of Metrics:- Numeric values that can be aggregated (sum, average, count, min, max)
- Used to measure performance, quantities, or calculated values
- Appear as values in charts (Y-axis, values in tables, chart data points)
- Can be broken down by dimensions to analyze patterns
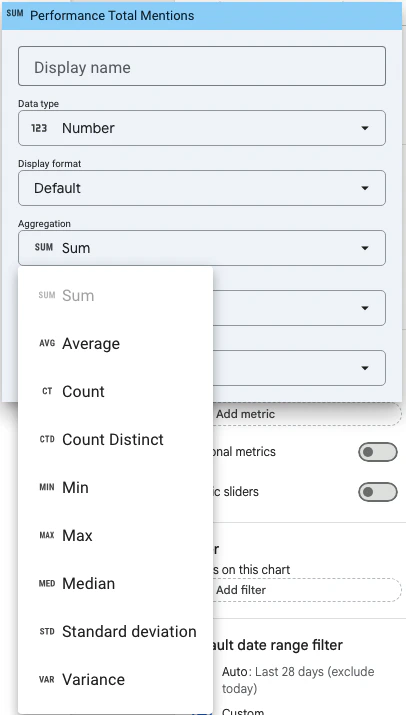
- Performance Total Prompts — count of prompts analyzed
- Performance Total Mentions — total number of brand mentions
- Performance Visibility Score — visibility percentage (0-100)
- Performance Rank — average ranking position
- Performance Avg Visibility Score — average visibility across models
Dimensions vs. Metrics: How They’re Used Differently?
Dimensions
- What they are — Categorical or descriptive fields (text, dates, IDs, booleans)
- Purpose — Group, filter, and segment data
- Where they appear — Row/column headers, filter controls, chart axes (X-axis)
- Example — Performance Website Name groups data by website
Metrics
- What they are — Numeric fields that can be aggregated (sum, average, count, etc.)
- Purpose — Measure performance, quantities, or calculated values
- Where they appear — Values in tables, chart data points, Y-axis values, scorecards
- Example — Performance Total Mentions counts how many mentions occurred
How They Work Together
- Dimensions provide context and categories (e.g., “by website” or “by date”)
- Metrics provide measurable outcomes (e.g., “total mentions” or “visibility score”)
- Example: A chart using Performance Website Name (dimension) on the X-axis and Performance Total Mentions (metric) on the Y-axis shows mentions per website, enabling performance comparisons and trend analysis
Complete Dimensions Reference for the Writesonic GEO connector
About Meta Fields Throughout the dimension tables below, you’ll see some fields marked as (meta field). A meta field refers to a field that contains information about the data itself, such as unique identifiers used for joining data sources or tracking timestamps.Common Dimensions (Available in All Data Sources)
Overall Website Performance Dimensions
Prompt Performance Dimensions
Individual AI Responses Dimensions
Content Citations & Sources Dimensions
Keyword Performance Metrics Dimensions
Configuration Dimensions
Available Topics
Available Platforms
Tracked Websites
Prompts Information
Available Tags
Complete Metrics Reference
Performance Summary Metrics
Calculation Notes
- Visibility Score —
(Total Mentions / Total Results) × 100 - Rank — Averaged across all mentions (only counted when brand is mentioned)
Performance Prompts Metrics
Performance Answers Metrics
Content Citations Metrics
Content Keywords Metrics
Configuration Metrics
Data Relationships & How to Use Them Together
Joining Data Sources
Link Performance Summary with Website ConfigCreating Your First Report
Quick Start: Executive Dashboard
Let’s build a dashboard that answers: “How is our AI visibility performing?”Step 1: Create the Data Source
- In Looker Studio, click Create → Data source
- Search for Writesonic GEO Presence
- Configure with your API key and Site URL
- Select the relevant data sources
- Click CONNECT
Step 2: Create a New Report
Click CREATE REPORT to open the report editor.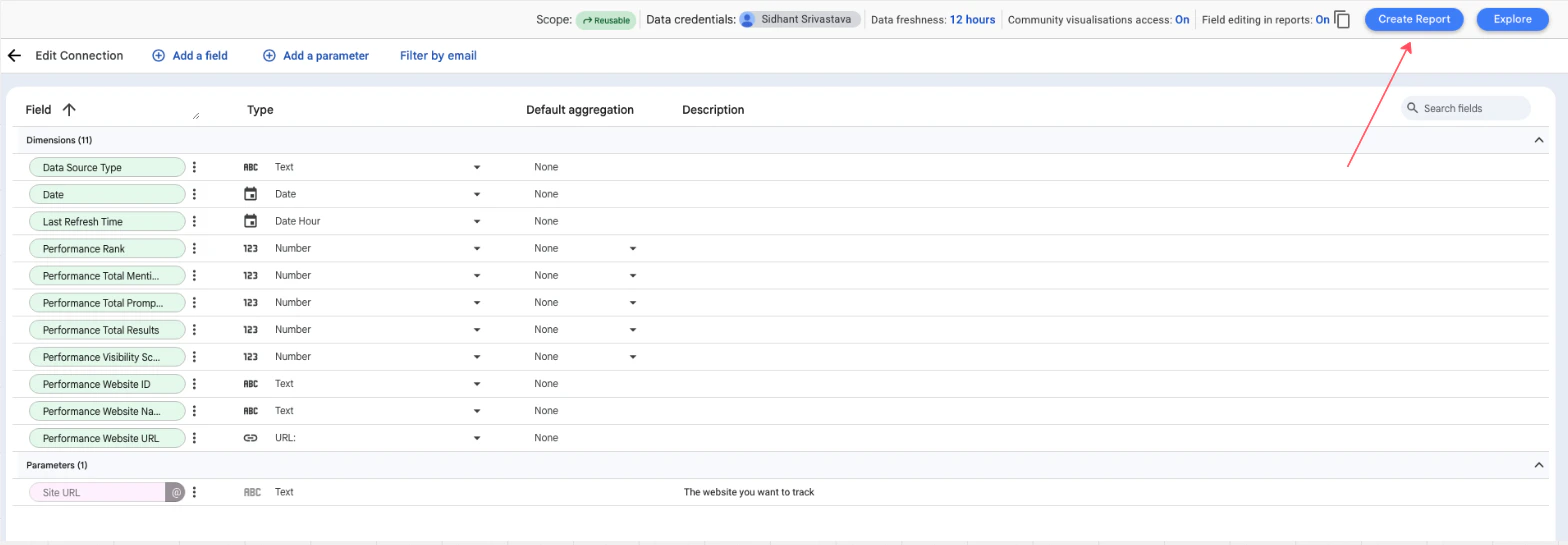
Step 3: Add Key Performance Scorecards (Sample)
Visibility Score Card- Add Chart → Scorecard
-
Metric:
Performance Visibility Score -
Date Range Dimension:
Date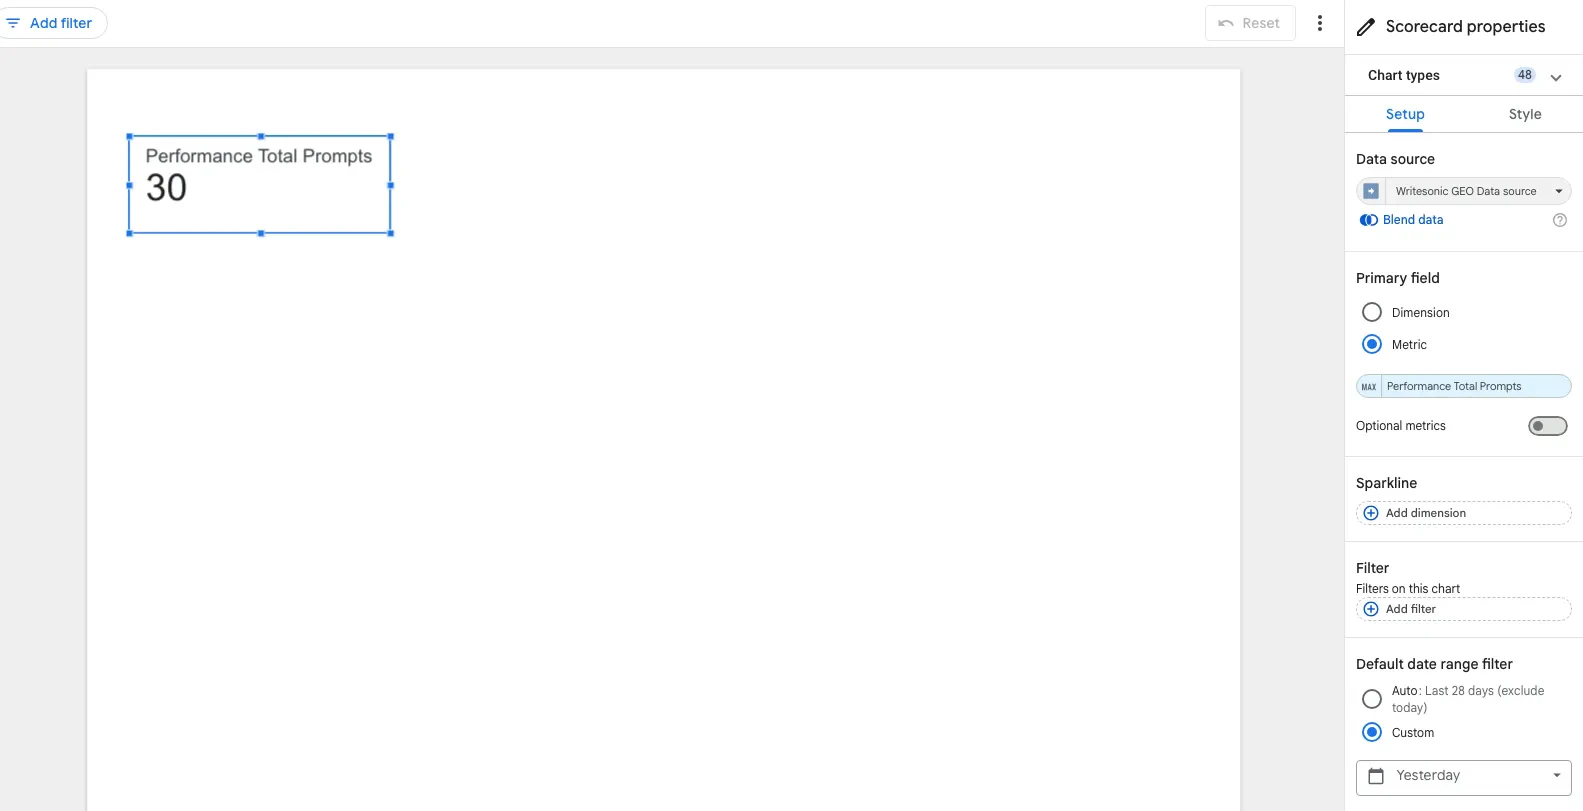
Troubleshooting
Common Issues
“Invalid API Key” or “401 Unauthorized”- Verify your API key from the Writesonic dashboard
- Ensure you’re using the Business API key with GEO Presence access
- Check for extra spaces when copying the key
- Verify URL format:
https://example.com(include protocol, no trailing slash) - Check the exact URL in your GEO Presence dashboard
- Ensure the site is active in your GEO Presence project
- Check date range: Try “Last 7 days” to ensure data exists
- Remove or relax filters to test
- Verify data source selection (Config data sources don’t require dates)
- Check GEO Presence dashboard for data availability
- Reduce date range to 1-3 days
- Select fewer data sources
- Use extract data (Data → Extract data) for historical analysis
- Limit visualizations per page (6-8 max)
- Manual refresh: Data menu → Refresh data
- Check Last Refresh Time field to verify data age
- Wait 5-10 minutes for API cache to expire
Getting Support
Technical Support — Email: [email protected] Include: Error details, account email, site URL (not API key) Sales/Enterprise — Email: [email protected]Frequently Asked Questions
Q: How often is data updated? A: Data is updated as new prompts are executed and AI responses collected. The connector uses caching (5-10 minutes) for performance. Q: Can I query data older than 7 days? A: This is currently not supported. Q: Why do some prompts show 0% visibility? A: The brand wasn’t mentioned in any AI responses for that prompt. This is valuable data for identifying content gaps. Q: What’s the difference between “Total Mentions” and “Prompt Total Mentions”? A: “Total Mentions” is website-level (Summary), “Prompt Total Mentions” is prompt-level (Prompts data source). Q: Can I track multiple websites in one report? A: Yes, but each data source connects to one site URL. Create multiple data sources and blend them. Q: Do rank values account for competitors? A: Yes, rank shows position among all mentioned brands in a response. Q: Why are my competitor visibility scores higher? A: This identifies opportunities. Study their cited content and topics to inform your strategy. Q: Can I export raw data? A: Yes, use Looker Studio’s export feature or query the API directly for raw JSON/CSV. Q: How do I calculate Share of Voice? A:Your Mentions / SUM(All Website Mentions) - create this as a calculated field.
Q: What does “Config Website Is Self = True” mean? A: It identifies your own website vs. competitors in the Website configuration.
Q: What is the “Prompt Type” dimension? A: Prompt Type classifies each prompt as either “Branded” (mentions your brand name directly) or “Non-Branded” (generic industry queries). It’s available in Prompt Performance, Individual AI Responses, and Prompts Information data sources. Use it to compare how your brand performs when explicitly asked about vs. discovered organically.
For advanced features and enterprise integrations, contact [email protected]
Tags Site Audit